The Self-Service Data Paradox: Why Good Tools Create More Questions Than Answers
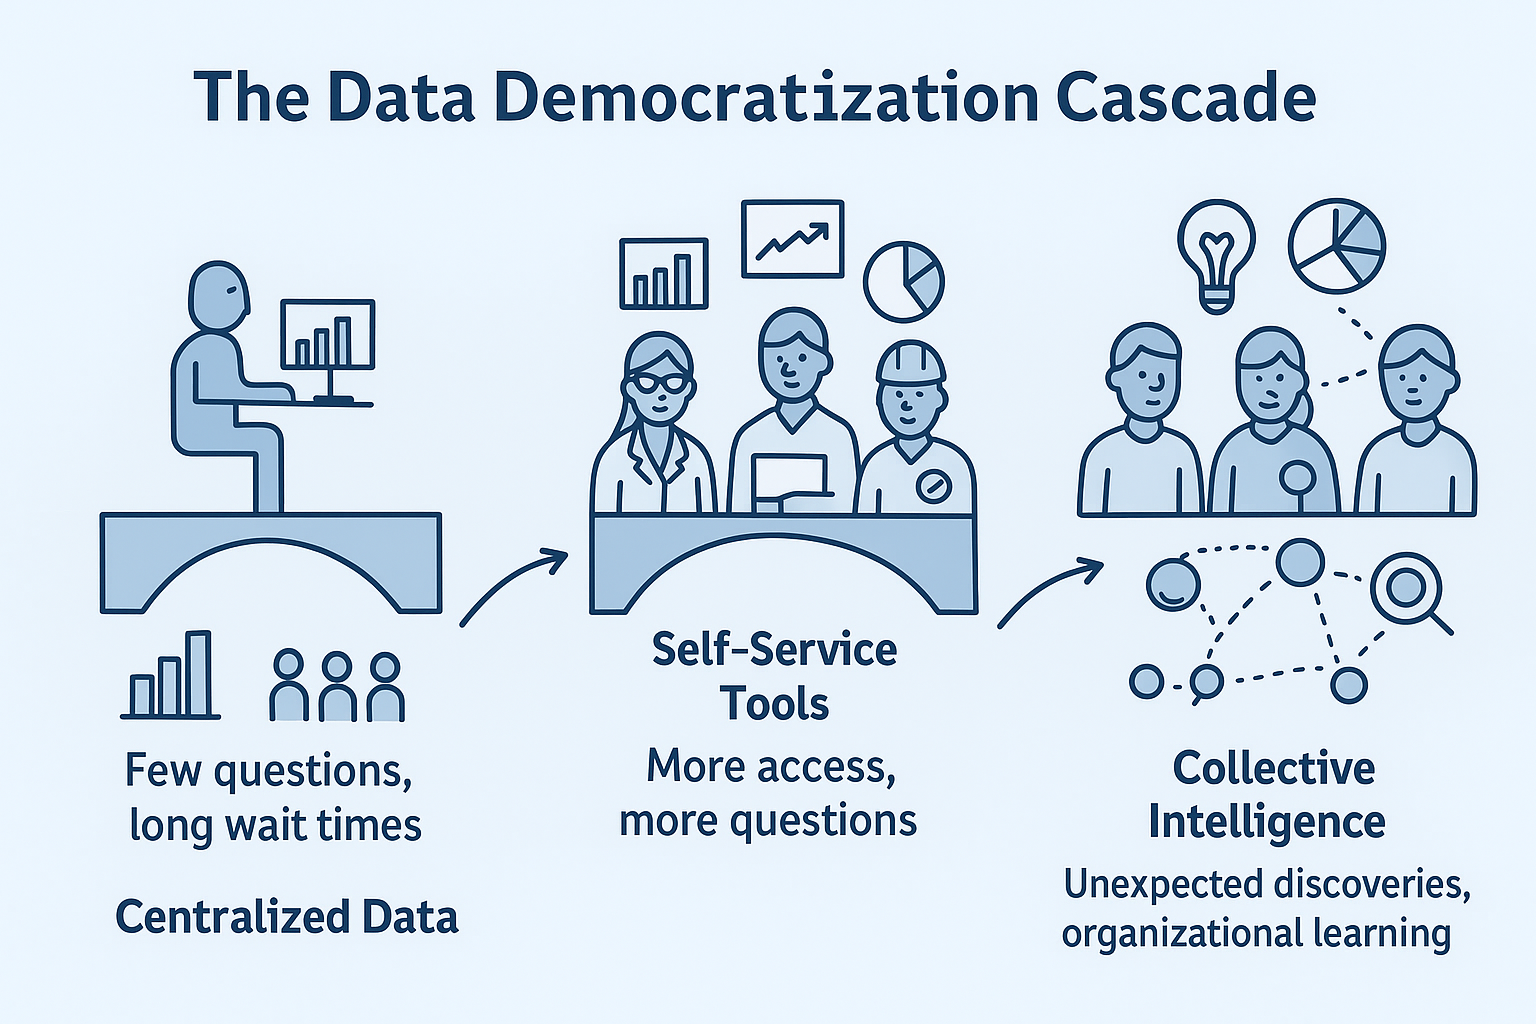
𝗧𝗵𝗲 𝗺𝗼𝗿𝗲 𝘀𝗲𝗹𝗳-𝘀𝗲𝗿𝘃𝗶𝗰𝗲 𝘁𝗼𝗼𝗹𝘀 𝘆𝗼𝘂 𝗯𝘂𝗶𝗹𝗱, 𝘁𝗵𝗲 𝗺𝗼𝗿𝗲 𝗾𝘂𝗲𝘀𝘁𝗶𝗼𝗻𝘀 𝗽𝗲𝗼𝗽𝗹𝗲 𝗮𝘀𝗸.
This isn’t a bug—it’s a feature. When scientists can independently explore their data, they discover patterns they never knew existed.
→ Simple dashboards lead to “Can I filter by this other variable?”
→ Basic visualizations spark “What if we overlay this dataset?”
→ Quick analyses become “Can we automate this for the whole pipeline?”
𝗧𝗵𝗲 𝗨𝗻𝗲𝘅𝗽𝗲𝗰𝘁𝗲𝗱 𝗖𝗼𝗻𝘀𝗲𝗾𝘂𝗲𝗻𝗰𝗲: 𝗢𝗿𝗴𝗮𝗻𝗶𝘇𝗮𝘁𝗶𝗼𝗻𝗮𝗹 𝗧𝗿𝗮𝗻𝘀𝗳𝗼𝗿𝗺𝗮𝘁𝗶𝗼𝗻 🚀
Suddenly, it’s not just the data team looking at results. Now you have:
→ Wet lab scientists spotting metadata inconsistencies
→ Project managers identifying workflow bottlenecks
→ Business stakeholders asking strategic questions about resource allocation
→ QC teams catching labeling errors that would have slipped through manual review
𝗧𝗵𝗲 𝗛𝗶𝘃𝗲 𝗠𝗶𝗻𝗱 𝗘𝗳𝗳𝗲𝗰𝘁
This distributed access creates something powerful: organizational collective intelligence. Different backgrounds bring different perspectives to the same data.
The computational biologist sees algorithmic patterns. The bench scientist notices experimental artifacts. The project manager spots resource trends. The quality team catches systematic errors.
Each viewpoint validates and enriches the others. Data quality improves not through more rigorous processes, but through more eyes on the problem.
𝗗𝗲𝘀𝗶𝗴𝗻𝗶𝗻𝗴 𝗳𝗼𝗿 𝘁𝗵𝗲 𝗣𝗮𝗿𝗮𝗱𝗼𝘅
The key insight: Design for the questions you’ll create, not just the ones you’re solving today.
→ Build flexibility into your data models from day one
→ Plan for cross-departmental access patterns you haven’t imagined yet
→ Create interfaces that grow with user sophistication
→ Establish feedback loops that capture emerging use cases
𝗧𝗵𝗲 𝗕𝗿𝗶𝗱𝗴𝗲 𝗕𝘂𝗶𝗹𝗱𝗲𝗿’𝘀 𝗣𝗲𝗿𝘀𝗽𝗲𝗰𝘁𝗶𝘃𝗲
The self-service paradox taught me that successful data democratization isn’t about reducing questions—it’s about enabling better questions. When you build tools that empower non-technical users to explore data independently, you’re not just solving today’s analysis bottleneck. You’re unleashing organizational curiosity.
The most successful data infrastructure projects I’ve led weren’t the ones that answered all questions. They were the ones that helped teams ask questions they never knew they needed to answer.
What’s the most unexpected question your self-service tools have generated? How has democratizing data access changed the conversations happening in your organization?